Exercise 7 Looking at Hurricane Tracks and using the Tracking Analyst:
Here is an image I captured from exercise 7, it demonstrates the magnitude of hurricanes that North America experiences off the coast, in the Atlantic ocean as well as the Pacific. I thought it was pretty fascinating, especially since most of these storms originate in 3 months only, August, September and October!

Exercise 6 Uwec Rooftop graphs for 2013:
For temperatures, January and
February had a lot of high and low temperatures that contrasted and the fluctuations
between temperatures and days were sometimes very great. However, for March and
April the temperatures seem to even out. The snow we had in January, February,
and March lead to little recorded precipitation, however as the temperatures
increased in April, we can see a great influx of rain, making April’s graph for
precipitation the greatest. By looking at the climographs for Wisconsin cites,
you can see that the lowest precipitation occurs in January and February, and
then March and April deliver a large amount of rain. Thus this March may be
considered an anomaly as there was little rain. For dominant winds, the earlier
months, saw winds coming from the west and northwest; yet in march there is a
shift to the south and west, indicating a change in Jetstream patterns that
welcome warmer temperatures.


Climographs for Exercise 6:

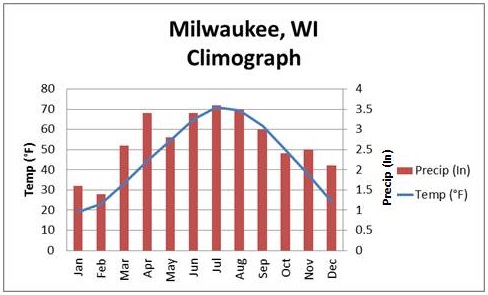

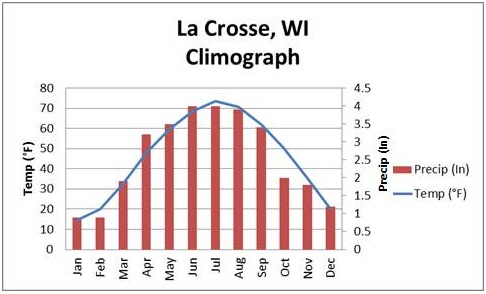

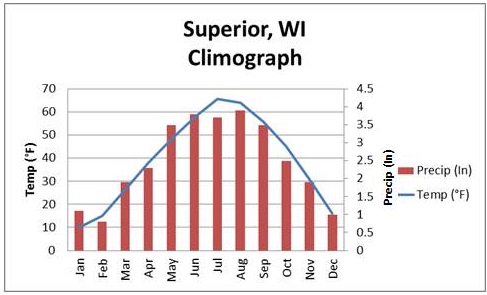

These climographs depict the average temperature and precipitation for each area over the period of one year.
Temperature and Precipitation graphs for Madison and Milwaukee, Wisconsin:


No comments:
Post a Comment